If there is one prayer that you should pray/sing every day and every hour, it is the
LORD's prayer (Our FATHER in Heaven prayer)
It is the most powerful prayer.
A pure heart, a clean mind, and a clear conscience is necessary for it.
- Samuel Dominic Chukwuemeka
For in GOD we live, and move, and have our being. - Acts 17:28
The Joy of a Teacher is the Success of his Students. - Samuel Chukwuemeka
Answer all questions.
Use at least two methods when applicable.
Show all work.
Unless stated otherwise; round the test statistic to two decimal places, and round the p-value to four decimal places as applicable.
Verify your answers with the calculators and RStudio software as applicable.
The names of the towns (in italics) are written to make you smile.
Yes, those towns exist. 😊
I want to make this topic fun in any way I can.
(1.)
Assume the curve is used for a two-tailed hypothesis test.
The p-value is 0.0888
(a.) If the two-tailed test was conducted at a 5% significance level, would you reject the null hypothesis OR fail to
reject the null hypothesis?
(b.) If the two-tailed test was conducted at a 10% level of significance, would you reject the null hypothesis OR fail to
reject the null hypothesis?
(c.) If we decided to do a right-tailed test instead at a 5% significance level, would you reject the null hypothesis OR fail to
reject the null hypothesis?
(2.) Claim: Fewer than 97% of adults have a cell phone.
In a reputable poll of 1217 adults, 89% said that they have a cell phone.
Find the value of the test statistic.
(Round to two decimal places as needed.)
$
H_0:\;\; p = 97\% = 0.97 \\[3ex]
q = 1 - p = 1 - 0.97 = 0.03 \\[5ex]
n = 1217 \\[3ex]
\hat{p} = 89\% = 0.89 \\[3ex]
z = \dfrac{\hat{p} - p}{\sqrt{\dfrac{pq}{n}}} \\[9ex]
z = \dfrac{0.89 - 0.97}{\sqrt{\dfrac{0.97(0.03)}{1217}}} \\[9ex]
z = -16.36020652 \\[3ex]
z \approx -16.36
$
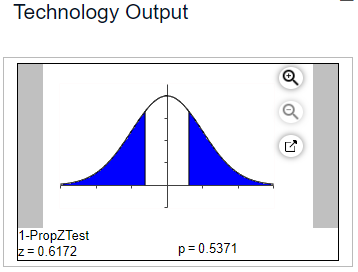
(3.) According to a reputable magazine, the dropout rate for all college students with loans is 30%.
Suppose that 64 out of 200 random college students with loans drop out.
The graphical technology output for this situation is:
(a.) Give the null and alternative hypotheses to test that the dropout rate is not 30%
(b.) What is the test statistic? (Round to four decimal places as needed).
(c.) What is the probability value? (Round to four decimal places as needed).
p = 30% = 0.3
(a.) The null and alternative hypotheses are:
$
H_0:\;\; p = 0.3 \\[3ex]
H_1:\;\; p \ne 0.3 \\[3ex]
$
(b.) The test statistic, z = 0.6172
(c.) The probability value, p = 0.5371
(4.) Claim: The mean systolic blood pressure of all healthy adults is less than than 124mmHg.
Sample data: For 279 healthy adults, the mean systolic blood pressure level is 123.93mmHg and the standard deviation is 15.71mmHg.
The null and alternative hypotheses are H0: μ = 124 and H1: μ < 124.
Find the value of the test statistic.
(Round to two decimal places as needed.)
$
H_0:\;\; \mu = 124\;mmHg \\[3ex]
n = 279 \\[3ex]
\bar{x} = 123.93\;mmHg \\[3ex]
s = 15.71\;mmHg \\[3ex]
t = \dfrac{\bar{x} - \mu}{\dfrac{s}{\sqrt{n}}} \\[9ex]
t = \dfrac{123.93 - 124}{\dfrac{15.71}{\sqrt{279}}} \\[9ex]
t = -0.0744258763 \\[3ex]
t \approx -0.07
$
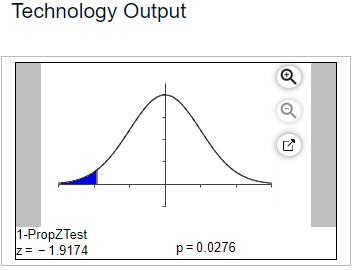
(5.) According to a reputable magazine, 32% of all cars sold in a certain country are SUVs.
Suppose a random sample of 500 recently sold cars shows that 140 are SUVs.
The graphical technology output for this situation is:
(a.) Give the null and alternative hypotheses to test that fewer than 32% of cars sold are SUVs
(b.) What is the test statistic? (Round to four decimal places as needed).
(c.) What is the probability value? (Round to four decimal places as needed).
p = 32% = 0.32
(a.) The null and alternative hypotheses are:
$
H_0:\;\; p = 0.32 \\[3ex]
H_1:\;\; p \lt 0.32 \\[3ex]
$
(b.) The test statistic, z = -1.9174
(c.) The probability value, p = 0.0276
(6.) Claim: The standard deviation of pulse rates of adult males is less than 10bpm.
For a random sample of 174 adult males, the pulse rates have a standard deviation of 8.6bpm.
Find the value of the test statistic.
(Round to two decimal places as needed.)
(7.) A college chemistry instructor thinks the use of embedded tutors will improve the success rate in introductory chemistry courses.
The passing rate for introductory chemistry is 57%.
During one semester, 200 students were enrolled in introductory chemistry courses with an embedded tutor.
Of these 200 students, 115 passed the course.
(a.) What is p̂, the sample proportion of students who passed introductory chemistry?
(b.) What is p0, the proportion of students who pass introductory chemistry if the null hypothesis is true?
(c.) Find the value of the test statistic. Explain the test statistic in context. (Round to two decimal places as needed.)
$
(a.) \\[3ex]
x = 115 \\[3ex]
n = 200 \\[3ex]
\hat{p} = \dfrac{x}{n} = \dfrac{115}{200} = 0.575 \\[5ex]
(b.) \\[3ex]
p_0 = 0.57 \\[3ex]
(c.) \\[3ex]
p = p_0 = 0.57 \\[3ex]
q = 1 - p = 1 - 0.57 = 0.43 \\[3ex]
z = \dfrac{\hat{p} - p}{\sqrt{\dfrac{pq}{n}}} \\[9ex]
z = \dfrac{0.575 - 0.57}{\sqrt{\dfrac{0.57 * 0.43}{200}}} \\[9ex]
z = 0.1428279973 \\[3ex]
z \approx 0.14 \\[3ex]
$
The value of the test statistic tells that the observed proportion of students who passed introductory chemistry was 0.14 standard errors above the null hypothesis proportion of students.
(8.) Suppose a researcher is testing someone to see if he or she can tell Soda X from Soda Y, and the researcher is
using 22 trials, half with Soda X and half with Soda Y.
The null hypothesis is that the person is guessing.
The alternative is one-sided, Ha: p > 5.
The person gets 14 right out of 22.
The p-value comes out to be 0.100.
Explain the meaning of the p-value.
A. The probability that a person will get exactly 14 right, if the person is truly guessing, is about 10%. B. The probability that a person will get 14 or more right, if the person is not just guessing, is about 10%. C. The probability that the person was not just guessing is about 10%. D. The probability that a person will get 14 or more right, if the person is truly guessing, is about 10%. E. The probability that the person was truly guessing is about 10%. F. The probability that a person will get exactly 14 right, if the person is not just guessing, is about 10%.
0.1% = 10%
The p-value is the probability that if the null hypothesis is true (the person is guessing), a test statistic (p) will have a value as extreme as or more extreme than the observed value (gets 14 or more right).
So, the correct option is: D.: The probability that a person will get 14 or more right, if the person is truly guessing, is about 10%.
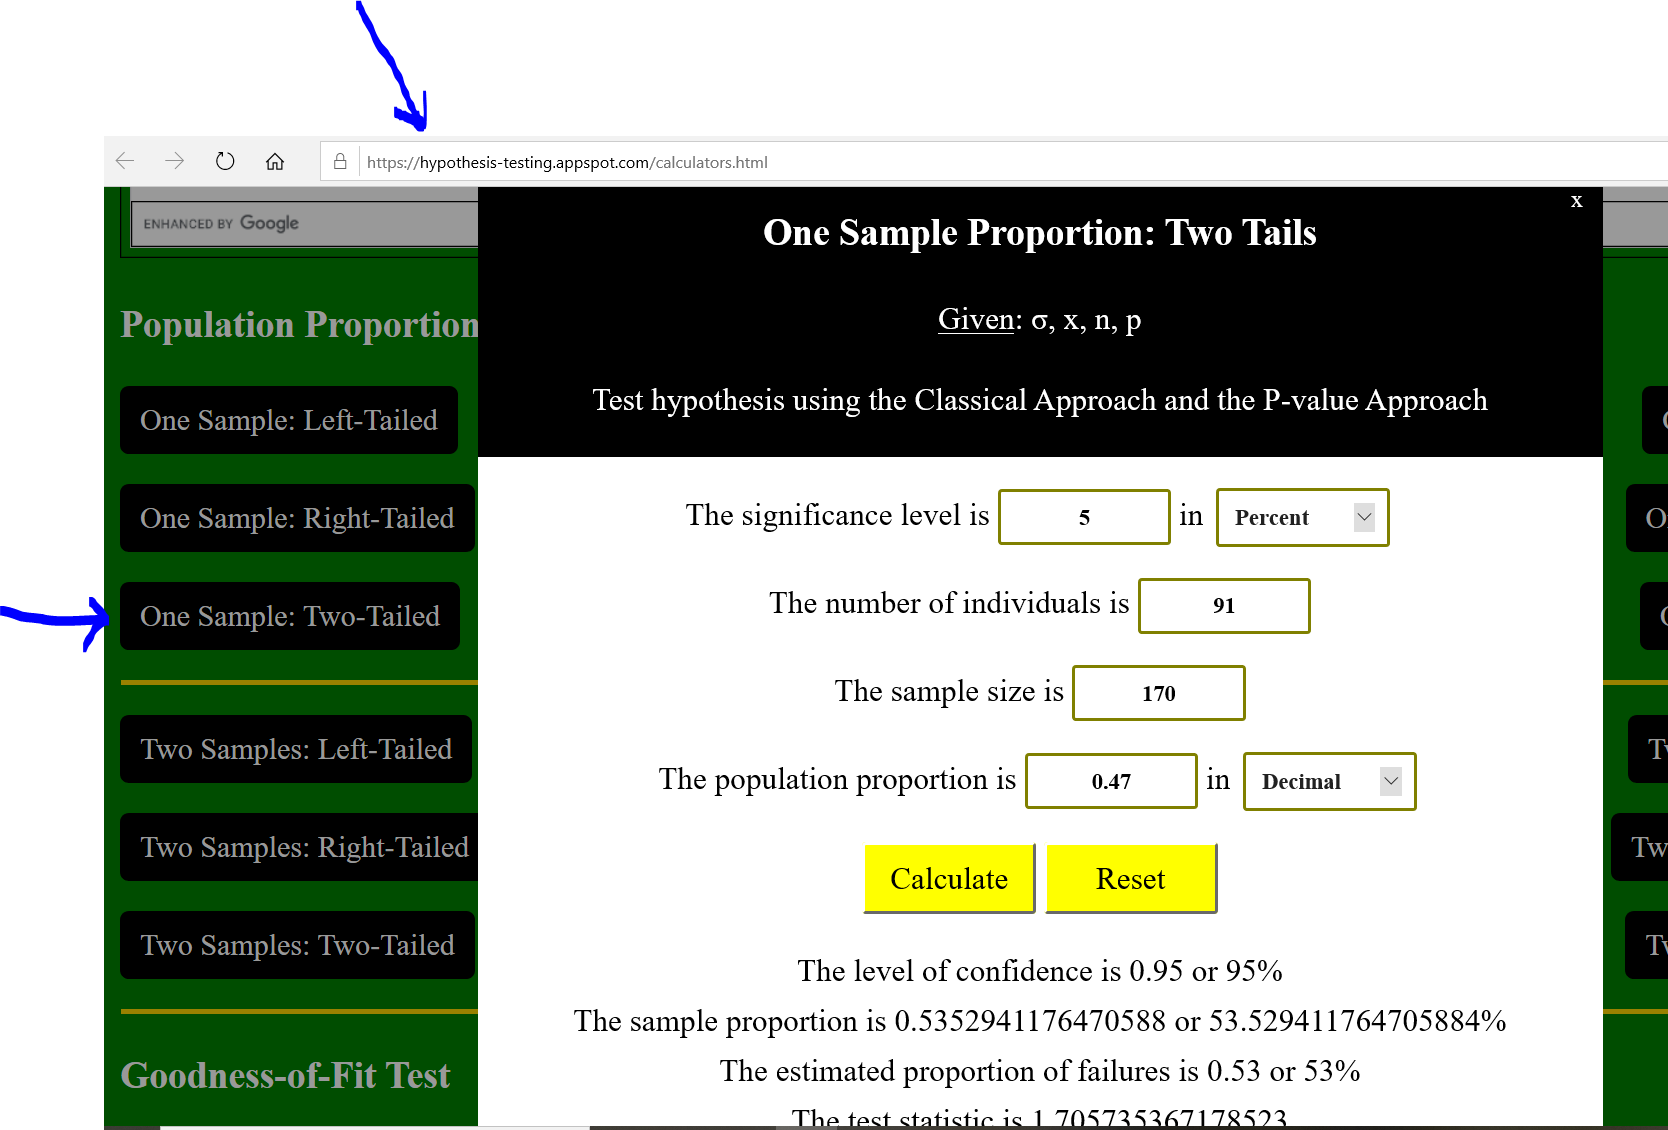
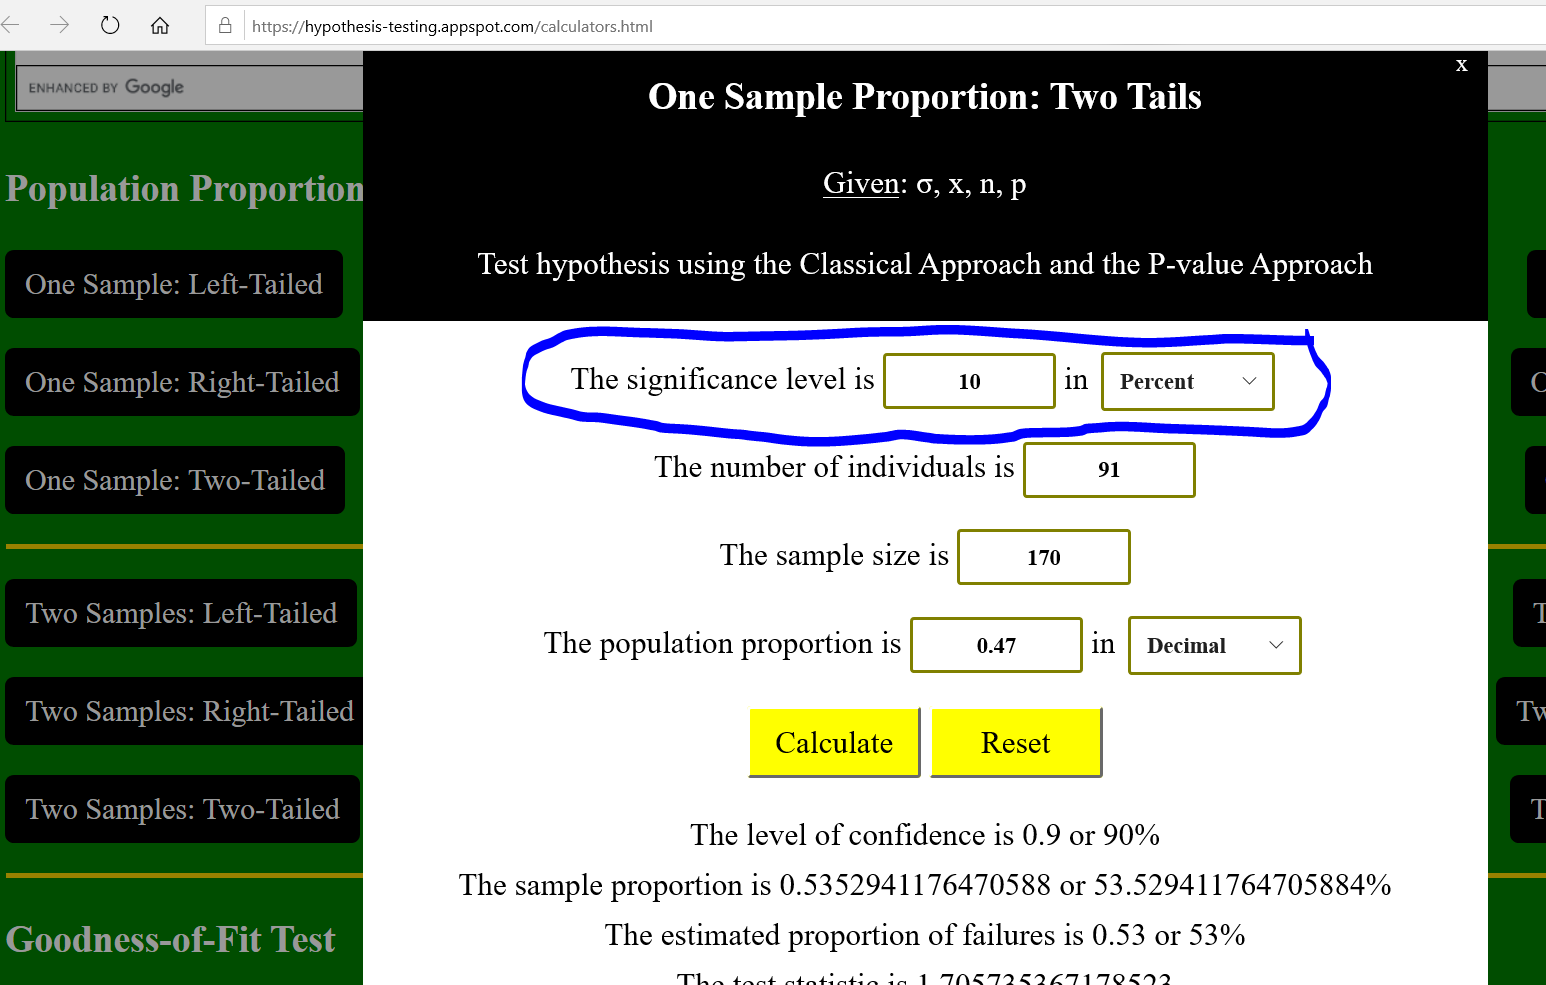
(9.) A local news agency in Pee Pee Township, Ohio (do they have to pee all the time!?) reports that
forty seven percent of the adult population regularly uses supplemental vitamins.
A manager at a local grocery store believes that number is significantly different and collects data from one hundred and
seventy randomly selected adults from the city to test the claim.
The table summarizes the data.
Adults Surveyed
Regularly takes supplemental vitamins
91
Does not regularly takes supplemental vitamins
79
Total
170
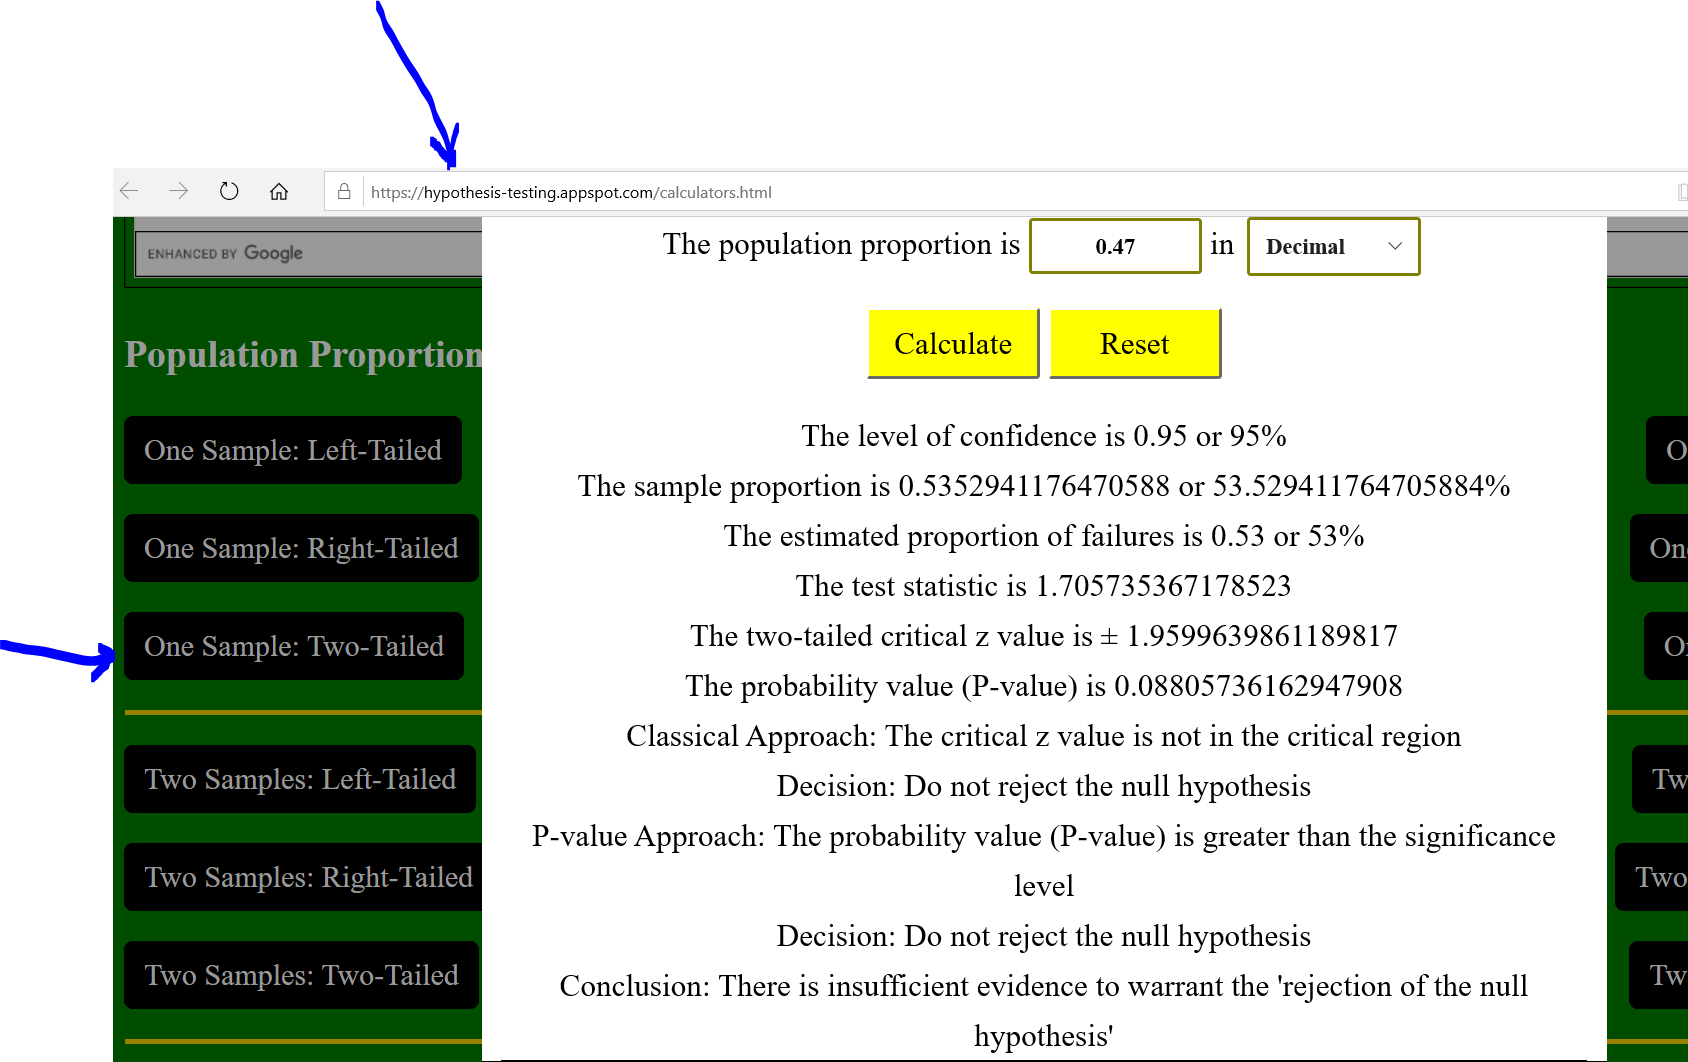
(a.) Test the hypothesis using the Critical Value Method
(b.) State the decision.
(c.) Test the hypothesis using the P-value Approach
(d.) State the decision.
(e.) State the conclusion.
Use a 5% level of significance.
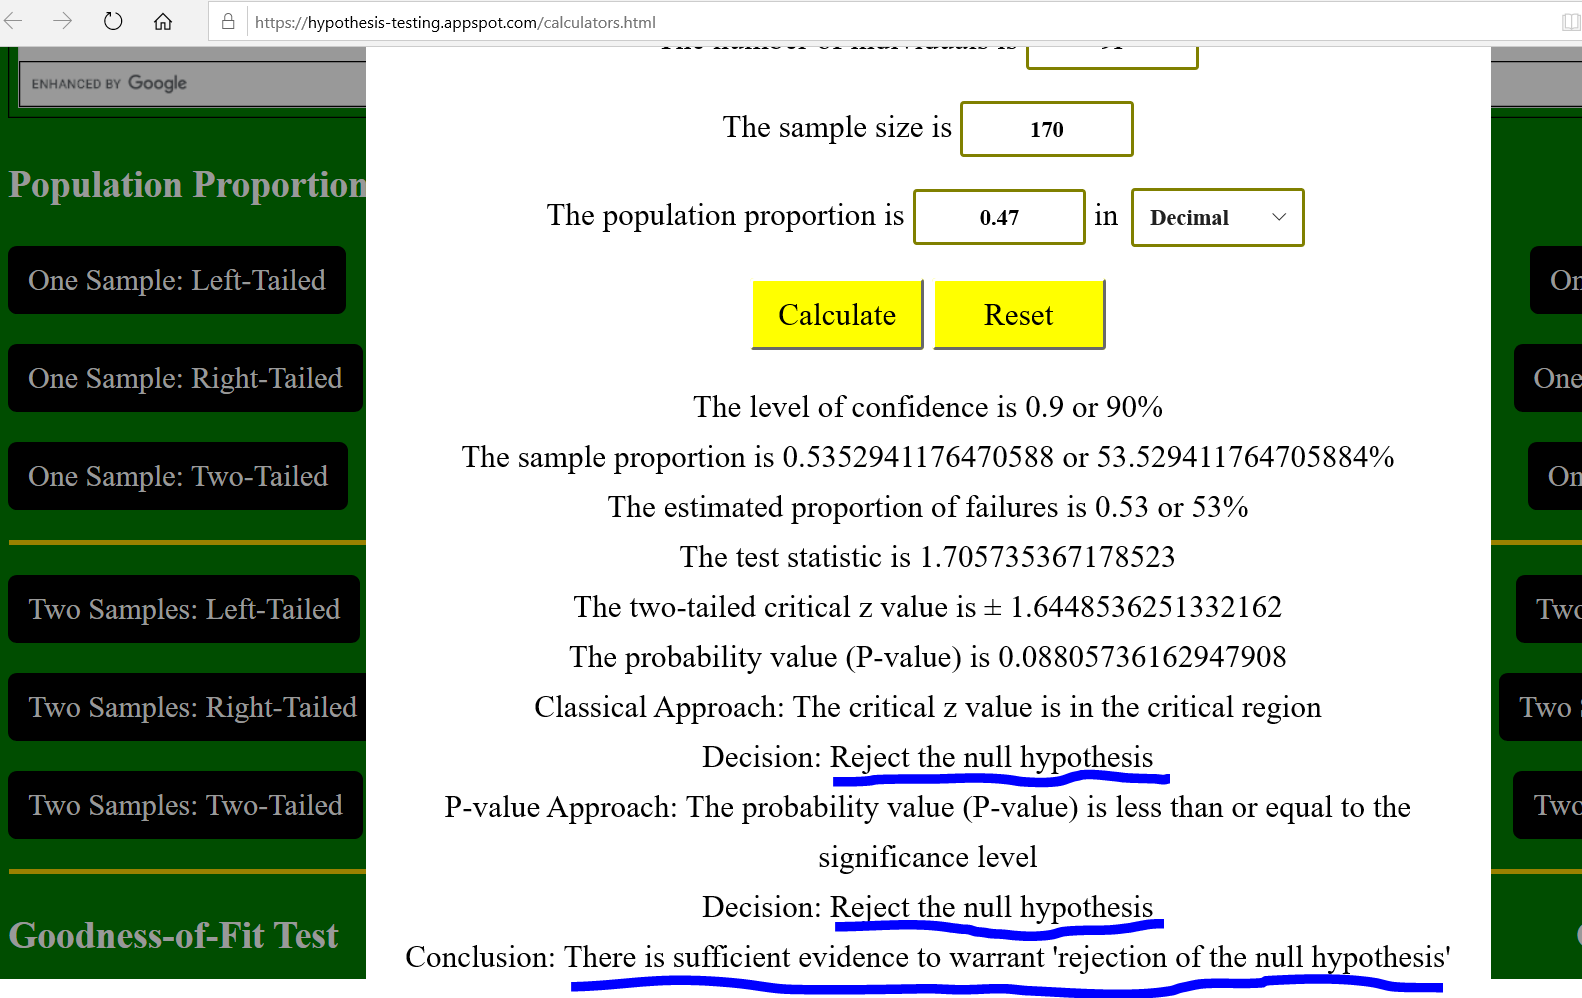
(f.) Determine a significance level that will change the conclusion.
We are only interested in the number of adults who regularly use supplemental vitamins
$
H_0:\:\: p = 0.47 \\[3ex]
H_1:\:\: p \ne 0.47 \\[3ex]
x = 91 \\[3ex]
n = 170 \\[3ex]
\hat{p} = \dfrac{x}{n} \\[5ex]
\hat{p} = \dfrac{91}{170} \\[5ex]
\hat{p} = 0.5352941176 \\[3ex]
p = 0.47 \\[3ex]
q = 1 - p \\[3ex]
q = 1 - 0.47 \\[3ex]
q = 0.53 \\[3ex]
z = \dfrac{\hat{p} - p}{\sqrt{\dfrac{pq}{n}}} \\[9ex]
z = \dfrac{0.5352941176 - 0.47}{\sqrt{\dfrac{0.47 * 0.53}{170}}} \\[9ex]
z = \dfrac{0.06529411765}{\sqrt{0.001465294118}} \\[5ex]
z = \dfrac{0.06529411765}{0.03827916036} \\[5ex]
z = 1.705735367 \\[3ex]
\alpha = 5\% = \dfrac{5}{100} = 0.05 \\[5ex]
\dfrac{\alpha}{2} = \dfrac{0.05}{2} = 0.025 \\[5ex]
\underline{Classical\:\:Approach} \\[3ex]
-z_{\dfrac{\alpha}{2}} = -1.9599639861189817 \\[5ex]
z_{\dfrac{\alpha}{2}} = 1.9599639861189817 \\[5ex]
-z_{\dfrac{\alpha}{2}} \lt z \lt z_{\dfrac{\alpha}{2}} \\[5ex]
-1.96 \lt 1.71 \lt 1.96 \\[3ex]
$
It does not fall in the critical region Decision: Do not reject the null hypothesis
Conclusion: There is insufficient evidence to warrant the rejection of the claim that forty seven percent of the adult population regularly
uses supplemental vitamins.
(f.)
To change the conclusion, there should be sufficient evidence to warrant the rejection of the claim that forty seven percent of the adult population regularly
uses supplemental vitamins.
This means that there should sufficient evidence to warrant the rejection of the null hypothesis.
This means that we have to change the decision as well (the decision led to the conclusion)
This means that we have to reject the null hypothesis
The easiest way to do this is to use the P-value Approach
For Two-tailed tests, we reject the null hypothesis if $P-value \le \alpha$
This means that we have to find a significance level that is greater than or equal to $P(z)$
$P(z) = 0.08805736166$
The common significance level that is greater than $0.08805736166$ is $0.1$
$0.1 = 10\%$
Therefore, the significance level that will change the conclusion is $10\%$
Let us verify with the calculator.
Student: Are you saying that if we test the hypothesis using a $1\%$ level of significance, the
conclusion will be the same? Teacher: That is correct.
Of the three most common significant levels, only the $10\%$ level of significance will give a different
conclusion.
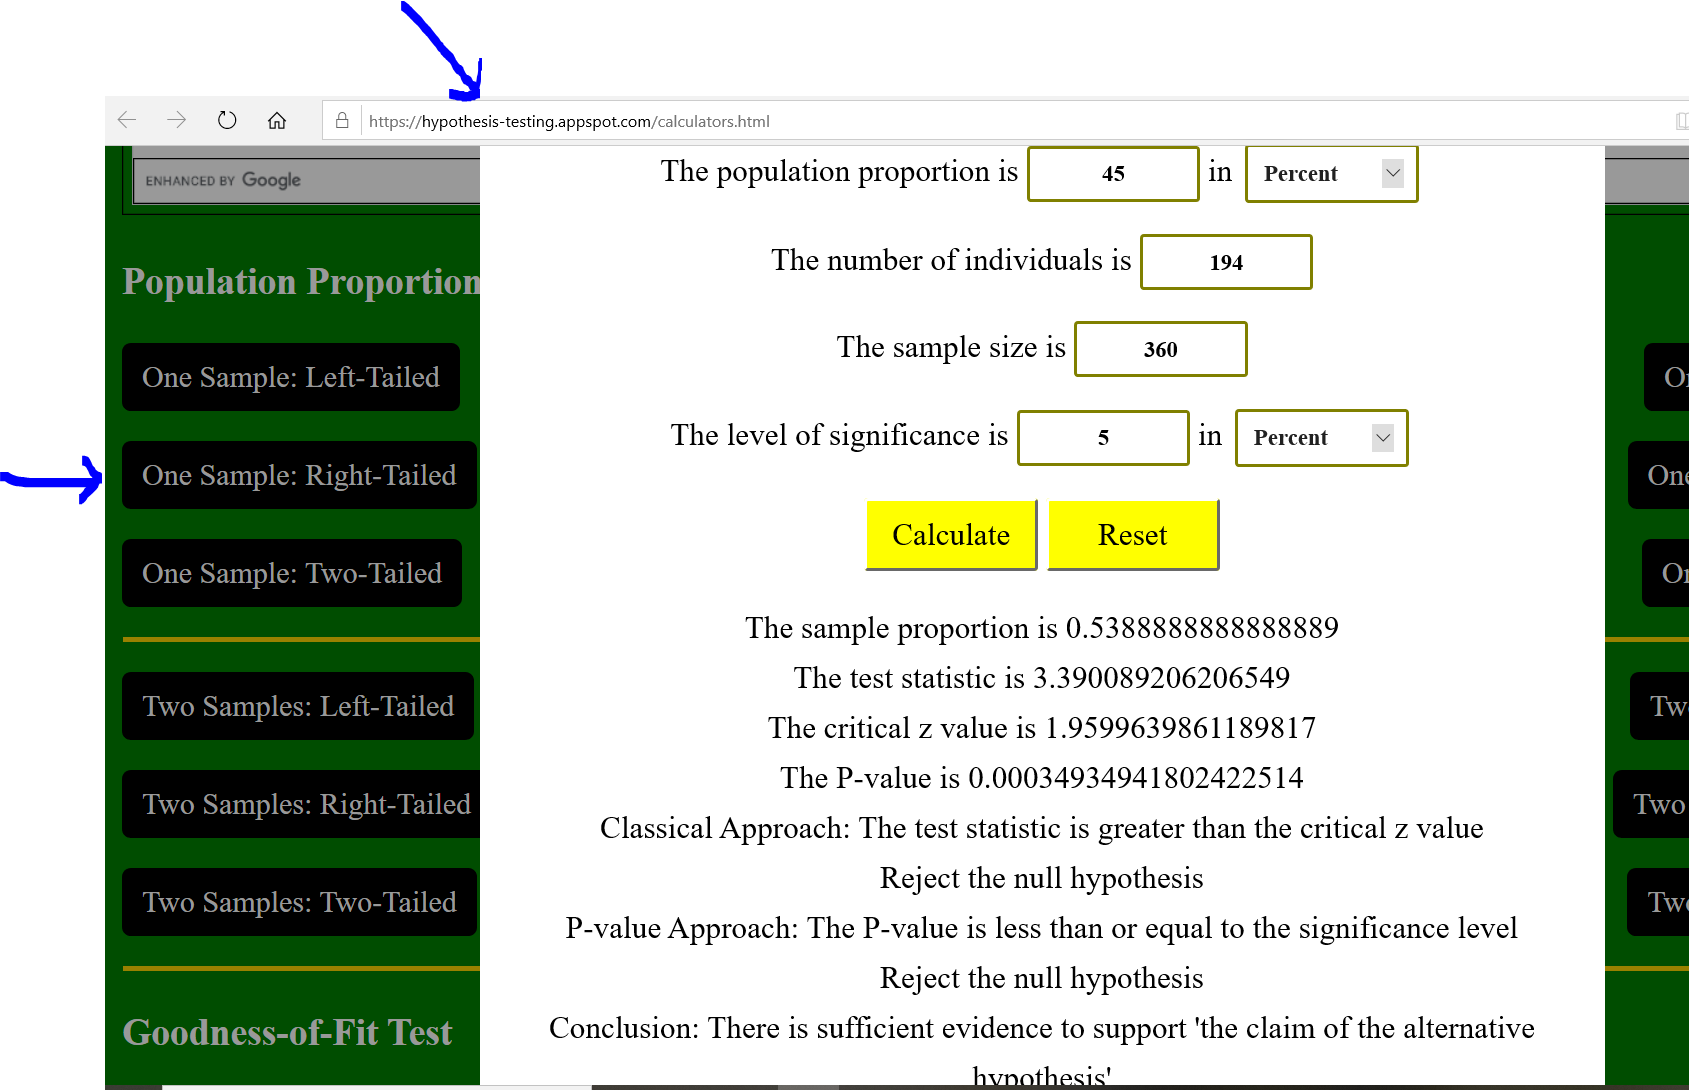
(10.) A college in the City of Los Baños, California (how frequent do they use the bathrooms?) wants to increase
its retention rate (the number of new students who begin one year and return the next year) of forty five percent.
After implementing several new programs to improve retention over a two-year period, the college randomly sampled three hundred and sixty students who started one year and found that one hundred and ninety four of them returned the next year.
The college wants to determine if the initiative is working to increase retention.
(a.) Test the hypothesis using the Classical Approach
(b.) State the decision.
(c.) Test the hypothesis using the P-value Approach
(d.) State the decision.
(e.) State the conclusion.
Use a 5% level of significance.
$
H_0:\:\: p = 0.45 \\[3ex]
H_1:\:\: p \gt 0.45 \\[3ex]
x = 194 \\[3ex]
n = 360 \\[3ex]
\hat{p} = \dfrac{x}{n} \\[5ex]
\hat{p} = \dfrac{194}{360} \\[5ex]
\hat{p} = 0.5388888889 \\[3ex]
p = 0.45 \\[3ex]
q = 1 - p \\[3ex]
q = 1 - 0.45 \\[3ex]
q = 0.55 \\[3ex]
z = \dfrac{\hat{p} - p}{\sqrt{\dfrac{pq}{n}}} \\[9ex]
z = \dfrac{0.5388888889 - 0.45}{\sqrt{\dfrac{0.45 * 0.55}{360}}} \\[9ex]
z = \dfrac{0.08888888889}{\sqrt{0.0006875}} \\[5ex]
z = \dfrac{0.08888888889}{0.0262202212} \\[5ex]
z = 3.390089206 \\[3ex]
\alpha = 5\% = \dfrac{5}{100} = 0.05 \\[5ex]
\dfrac{\alpha}{2} = \dfrac{0.05}{2} = 0.025 \\[5ex]
\underline{Classical\:\:Approach} \\[3ex]
z_{\dfrac{\alpha}{2}} = 1.9599639861189817 \\[5ex]
z \gt z_{\dfrac{\alpha}{2}} \\[5ex]
3.39 \gt 1.96 \\[3ex]
$
It falls in the critical region Decision: Reject the null hypothesis
Conclusion: There is sufficient evidence to support the claim that the initiative is working to increase retention.
(11.) Suppose an experiment is done with criminals released from prison in a certain state where the recidivism rate is 34%; that is, 34% of criminals return to prison within three years.
One hundred random prisoners are made to attend a "boot camp" for two weeks before their release, and it is hoped that "boot camp" will have a good effect.
Suppose 39 of those prisoners return to prison within three years.
The null hypothesis is that those attending boot camp have a recidivism rate of 34%, p = 0.34.
(a.) What is p̂, the sample proportion of successes? (It is somewhat odd to call returning to prison a success.)
(b.) What is p0, the hypothetical proportion of success under the null hypothesis?
(c.) What is the value of the test statistic? Explain in context. (Round to two decimal places as needed.)
$
(a.) \\[3ex]
x = 39 \\[3ex]
n = 100 \\[3ex]
\hat{p} = \dfrac{x}{n} = \dfrac{39}{100} = 0.39 \\[5ex]
(b.) \\[3ex]
p_0 = 0.34 \\[3ex]
(c.) \\[3ex]
p = p_0 = 0.34 \\[3ex]
q = 1 - p = 1 - 0.34 = 0.66 \\[3ex]
z = \dfrac{\hat{p} - p}{\sqrt{\dfrac{pq}{n}}} \\[9ex]
z = \dfrac{0.39 - 0.34}{\sqrt{\dfrac{0.34 * 0.66}{100}}} \\[9ex]
z = 1.055500827 \\[3ex]
z \approx 1.06 \\[3ex]
$
The value of the test statistic tells that the observed proportion of prisoners was 1.06 standard errors above the null hypothesis proportion of prisoners.
(12.) A college chemistry instructor thinks the use of embedded tutors will improve the success rate in introductory chemistry courses.
The passing rate for introductory chemistry is 72%.
During one semester, 200 students were enrolled in introductory chemistry courses with an embedded tutor.
Of these 200 students, 159 passed the course.
The instructor carried out a hypothesis test and found that the observed value of the test statistic was 2.36.
The p-value associated with this test statistic is 0.0091.
(a.) State the hypotheses that were used for the test.
(b.) Explain the meaning of the p-value in this context.
(c.) Based on this result, should the instructor believe the success rate has improved?
(a.) 72% = 0.72
Null hypotheses: The passing rate for introductory chemistry is 72%.
Alternative hypotheses: A college chemistry instructor thinks the use of embedded tutors will improve the success rate in introductory chemistry courses.
$
H_0:\;\; p = 0.72 \\[3ex]
H_1:\;\; p \gt 0.72 \\[3ex]
$
(b.) The p-value is the probability (0.0091) that if the null hypothesis is true (the passing rate for introductory chemistry is 72%), a test statistic (z = 2.36) will have a value as extreme as or more extreme than the observed value (will greatly improve the success rate in introductory chemistry courses).
In the context of the question, this implies that:
The probability of 159 or more introductory chemistry students passing out of a random sample of 200 students is 0.0091, assuming the population proportion is 0.72.
(c.) In this situation, the p-value is small (less than 0.05), so the instructor should believe the success rate has improved.
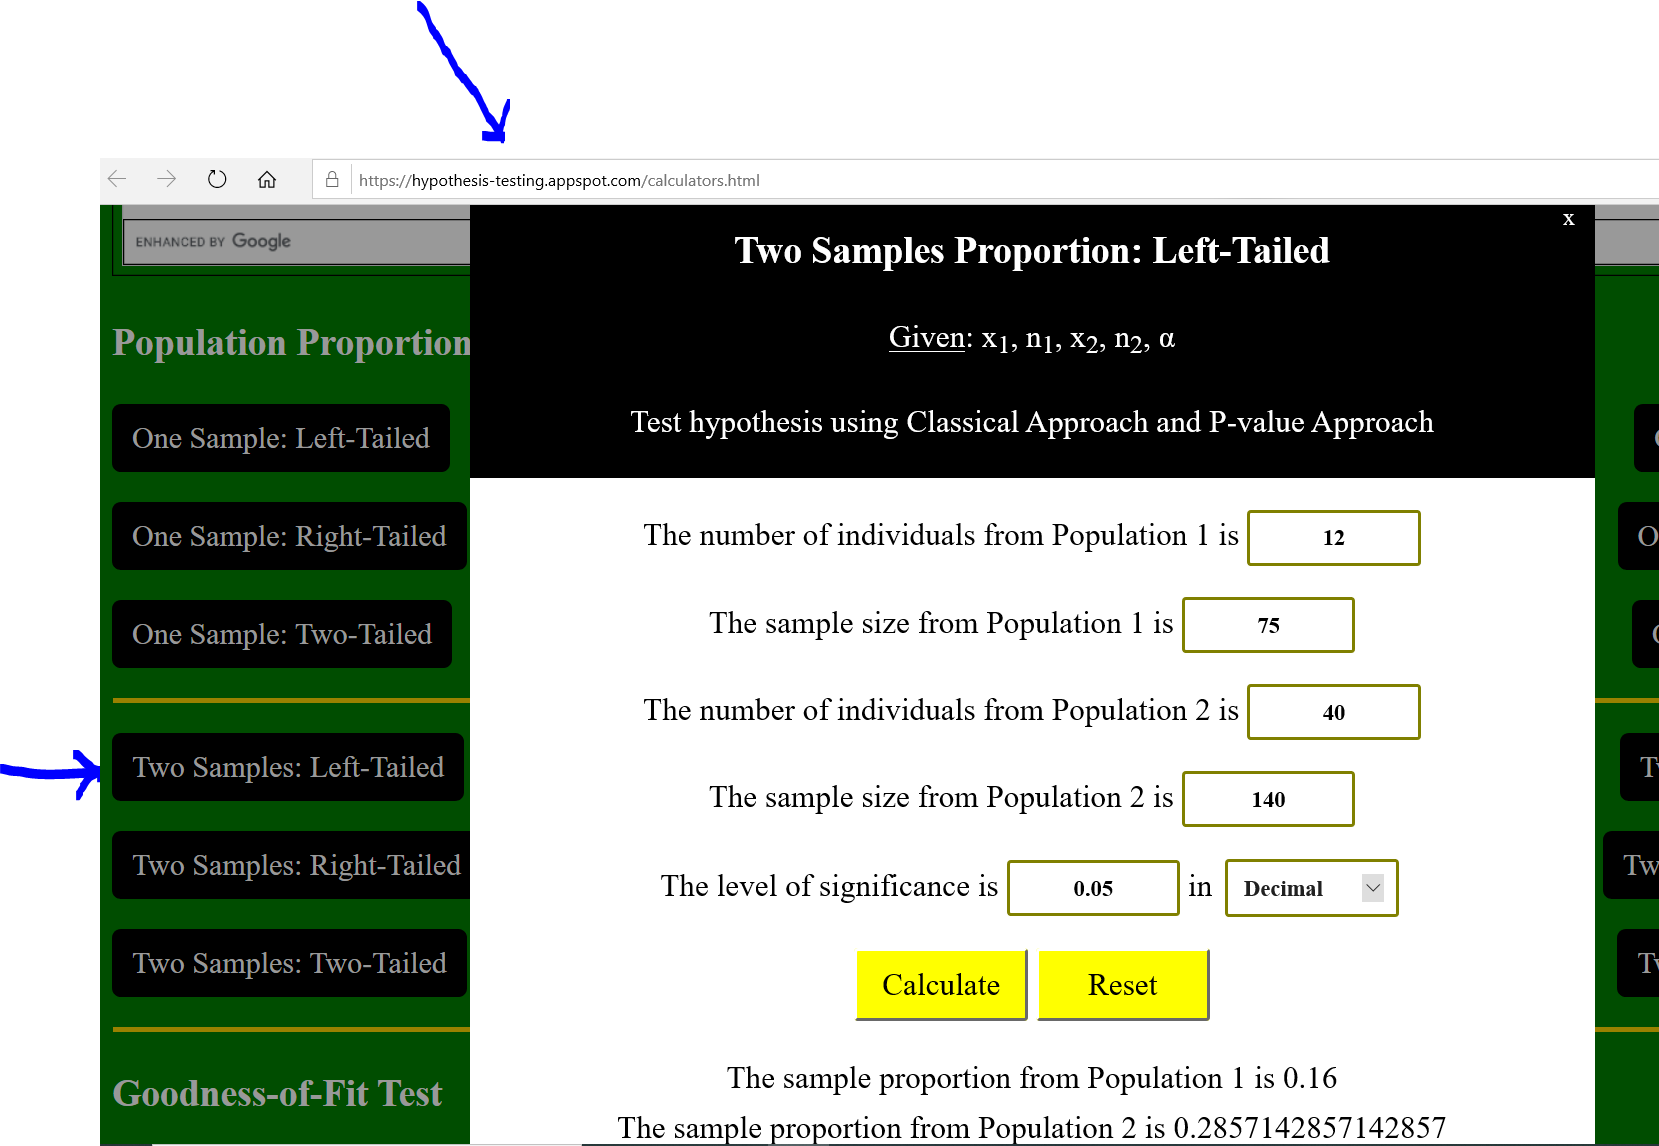
(13.) A researcher made a claim that the proportion of urban families who regularly eat lunch together is statistically
lower than the proportion of rural families.
The table displays the summary of her data collection survey.
$x_1$ is the number of urban families who regularly eat lunch.
$n_1$ is the total number of urban families.
$x_2$ is the number of rural families who regularly eat lunch.
$n_2$ is the total number of rural families.
Urban Families Surveyed
Rural Families Surveyed
$x_1$ = 12
$x_2$ = 40
$n_1$ = 75
$n_2$ = 140
(a.) Calculate the sample proportions.
Do the initial (untested) findings show what the researcher expected?
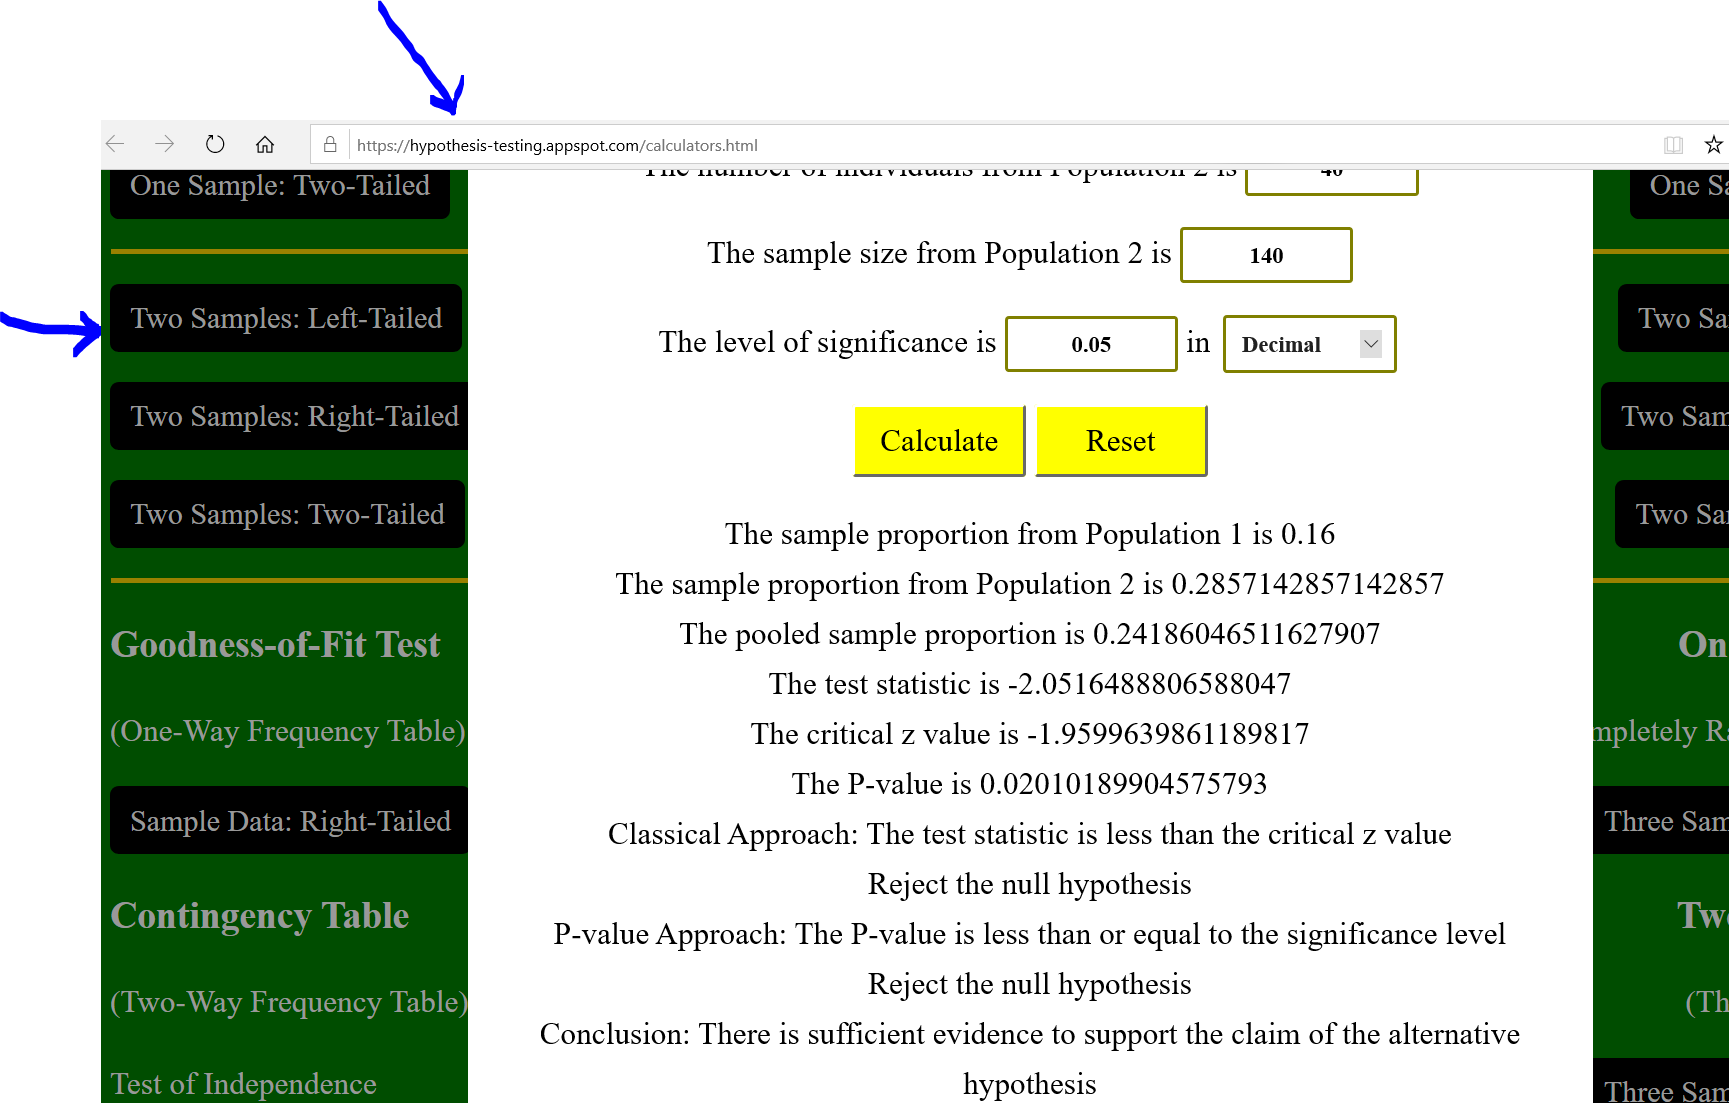
(b.) Test the hypothesis using the Classical Approach
(c.) State the decision.
(d.) Test the hypothesis using the P-value Approach
(e.) State the decision.
(f.) State the conclusion.
Use a 5% level of significance.
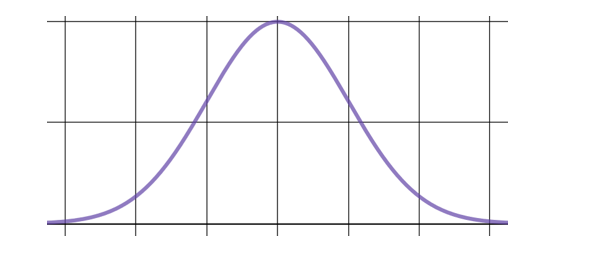
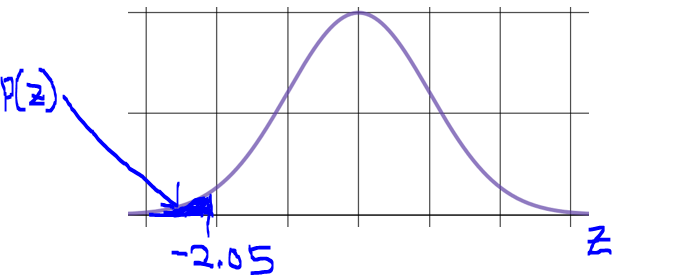
(g.) Use the Standard Normal Curve below to mark the location of the test statistic and shade the area that corresponds
to the P-value.
$\hat{p_1}$ is the first sample proportion (proportion of urban families who regularly eat lunch together)
$\hat{q_1}$ is the complement of the first sample proportion
$\hat{p_2}$ is the second sample proportion (proportion of rural families who regularly eat lunch together)
$\hat{q_2}$ is the complement of the second sample proportion
$\overline{p}$ is the pooled sample proportion
$\overline{q}$ is the complement of the pooled sample proportion
$
H_0:\:\: p_1 = p_2 \:\:OR\:\: p_1 - p_2 = 0 \\[3ex]
H_1:\:\: p_1 \lt p_2 \\[3ex]
\hat{p_1} = \dfrac{x_1}{n_1} \\[5ex]
\hat{p_1} = \dfrac{12}{75} \\[5ex]
\hat{p_1} = 0.16 \\[3ex]
\hat{p_2} = \dfrac{x_2}{n_2} \\[5ex]
\hat{p_2} = \dfrac{40}{140} \\[5ex]
\hat{p_2} = 0.2857142857 \\[3ex]
0.16 \lt 0.2857142857 \\[3ex]
$
Yes, these sample proportions show what the researcher expected.
The sample proportion of urban families who regularly eat lunch together is lower than the sample proportion of rural families who regularly
eat lunch together because $0.16 \lt 0.2857142857$
$
\overline{p} = \dfrac{x_1 + x_2}{n_1 + n_2} \\[5ex]
\overline{p} = \dfrac{12 + 40}{75 + 140} \\[5ex]
\overline{p} = \dfrac{52}{215} \\[5ex]
\overline{p} = 0.2418604651 \\[3ex]
\overline{q} = 1 - 0.2418604651 \\[3ex]
\overline{q} = 0.7581395349 \\[3ex]
z = \dfrac{(\hat{p_1} - \hat{p_2}) - (p_1 - p_2)}{\sqrt{\dfrac{\overline{p} *
\overline{q}}{n_1} + \dfrac{\overline{p} * \overline{q}}{n_2}}} \\[10ex]
z = \dfrac{(0.16 - 0.2857142857) - 0}{\sqrt{\dfrac{0.2418604651 *
0.7581395349}{75} + \dfrac{0.2418604651 * 0.7581395349}{140}}} \\[10ex]
z = \dfrac{-0.1257142857}{\sqrt{\dfrac{0.1833639805}{75} + \dfrac{0.1833639805}{140}}} \\[10ex]
z = \dfrac{-0.1257142857}{\sqrt{0.002444853074 + 0.001309742718}} \\[7ex]
z = \dfrac{-0.1257142857}{\sqrt{0.003754595792}} \\[7ex]
z = \dfrac{-0.1257142857}{0.06127475656} \\[7ex]
z = -2.05164888 \\[3ex]
\alpha = 5\% = \dfrac{5}{100} = 0.05 \\[5ex]
\dfrac{\alpha}{2} = \dfrac{0.05}{2} = 0.025 \\[5ex]
\underline{Classical\:\:Approach} \\[3ex]
-z_{\dfrac{\alpha}{2}} = -1.9599639861189817 \\[5ex]
z \lt -z_{\dfrac{\alpha}{2}} \\[5ex]
-2.05164888 \lt -1.9599639861189817 \\[3ex]
$
It falls in the critical region Decision: Reject the null hypothesis
Conclusion: There is sufficient evidence to support the claim that the sample proportion of urban families who regularly eat lunch together is lower than the sample proportion of rural families who regularly
eat lunch together.
(14.) Suppose a researcher is testing someone to see whether she or he can tell Soda X from Soda Y, and the researcher is using 30 trials, half with Soda X and half with Soda Y.
The null hypothesis is that the person is guessing.
(a.) About how many should the researcher expect the person to get right under the null hypothesis that the person is guessing?
(b.) Suppose person A gets 21 right out of 30, and person B gets 19 right out of 30.
Which will have a smaller p-value, and why?
(a.) If the population proportion, p is not given, then assume p = 50% = 0.5
50% of 30 trials = 0.5(30) = 15
The person should get 15 trials right.
$
(b.) \\[3ex]
\underline{Person\;A} \\[3ex]
x = 21 \\[3ex]
n = 30 \\[3ex]
\hat{p} = \dfrac{x}{n} = \dfrac{21}{30} = 0.7 \\[5ex]
\underline{Person\;B} \\[3ex]
x = 19 \\[3ex]
n = 30 \\[3ex]
\hat{p} = \dfrac{x}{n} = \dfrac{19}{30} = 0.6333333333 \\[5ex]
$
0.7 > 0.6333333333; therefore
Person A will have a smaller p-value because that person's number of successes is further from the hypothesized number of successes
(15.) A certain county is 24% African American.
Suppose a researcher is looking at jury pools, each with 200 members, in this county.
The null hypothesis is that the probability of an African American being selected into the jury pool is 24%.
(a.) How many African Americans would the researcher expect on a jury pool of 200 people if the null hypothesis is true?
(b.) Suppose pool A contains 35 African American people out of 200, and pool B contains 26 African American people out of 200.
Which will have a smaller p-value and why?
(a.) Number of African Americans the researcher would expect in a jury pool of 200 people is:
$
24\% \;\;of\;\; 200 \\[3ex]
= 0.24(200) \\[3ex]
= 48\;\;African\;\;Americans \\[3ex]
$
(b.) Expected hypothesized number of successes: 48
Pool A number of succcesses: 35 African American
Pool B number of successes: 26 African American
Which of them is further from 48?
|48 - 35| = |13| = 13
|48 - 26| = |22| = 22
13 > 12
Pool B will have a smaller p-value because that pool's number of African American people is further from the hypothesized number.
(16.)
(17.)
(18.)
(19.) A hospital readmission is an episode when a patient who has been discharged from a hospital is readmitted again within a certain time period.
Nationally the readmission rate for patients with pneumonia is 18%.
A hospital was interested in knowing whether their readmission rate for pneumonia was less than the national percentage.
They found 14 patients out of 80 treated for pneumonia in a two-month period were readmitted.
(a.) What is p̂, the sample proportion of readmission? (Round to three decimal places as needed).
(b.) Write the null and alternative hypotheses.
(c.) Find the value of the test statistic and explain it in context. (Round to two decimal places as needed).
(d.) The p-value associated with this test statistic is 0.45.
Explain the meaning of the p-value in this context.
Based on this result, does the p-value indicate the null hypothesis should be doubted?
$
(a.) \\[3ex]
x = 14 \\[3ex]
n = 80 \\[3ex]
\hat{p} = \dfrac{x}{n} = \dfrac{14}{80} = 0.175 \\[5ex]
$
(b.) 18% = 0.18
Null hypotheses: Nationally the readmission rate for patients with pneumonia is 18%.
Alternative hypotheses: A hospital was interested in knowing whether their readmission rate for pneumonia was less than the national percentage.
$
H_0:\;\; p = 0.18 \\[3ex]
H_1:\;\; p \lt 0.18 \\[3ex]
(c.) \\[3ex]
q = 1 - p = 1 - 0.18 = 0.82 \\[3ex]
z = \dfrac{\hat{p} - p}{\sqrt{\dfrac{pq}{n}}} \\[9ex]
z = \dfrac{0.175 - 0.18}{\sqrt{\dfrac{0.18 * 0.82}{80}}} \\[9ex]
z = -0.1164050493 \\[3ex]
z \approx -0.12 \\[3ex]
$
This implies that:
The value of the test statistic tells that the observed proportion of readmissions was 0.12 standard errors below the null hypothesis proportion of readmissions.
(it is below because of the negative sign)
(d.) The p-value is the probability (0.45) that if the null hypothesis is true (Nationally the readmission rate for patients with pneumonia is 18%.), a test statistic (z = -0.12) will have a value as extreme as or more extreme than the observed value (their readmission rate for pneumonia was very less than the national percentage).
In the context of the question, this implies that:
The probability of getting 14 or fewer readmissions for pneumonia of a random sample of 80 patients with pneumonia is 0.45, assuming the population proportion is 0.18.
In this situation, the p-value is not small (because it is greater than 0.05), which indicates that the null hypothesis should not be doubted.
(22.) A 55-question multiple choice quiz has five choices for each question.
Suppose that a student just guesses, hoping to get a high score.
The teacher carries out a hypothesis test to determine whether the student was just guessing.
The null hypothesis is p = 0.20, where p is the probability of a correct answer.
(a.) Which of the following describes the value of the z-test statistic that is likely to result?
Explain your choice.
(i.) The z-test statistic will be close to 0.
(ii.) The z-test statistic will be far from 0
(b.) Which of the following describes the p-value that is likely to result?
Explain your choice.
(i.) The p-value will be small.
(ii.) The p-value will not be small.
(a.) The null hypothesis is p = 0.20, where p is the probability of a correct answer.
The null hypotheses is true (or assumed to be true)
It makes sense that the probability of getting a correct answer by guessing is 20% so we assume the null hypothesis to be true
The test statistic compares the observed outcome with the outcome of the null hypothesis (expected outcome).
For this case, the observed outcome is close to the expected outcome.
Hence, the z-test statistic will be close to 0.
(b.) Because the null hypothesis is true, obtaining an unusual result is not likely.
Hence, the p-value will not be small.
 Probability Distribution Calculators